Assumptions of Linear Regression
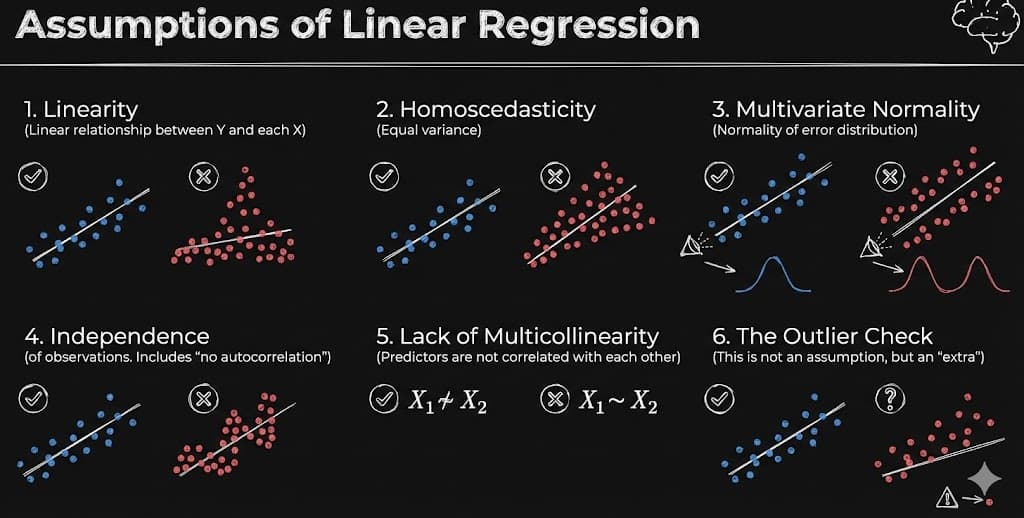
1. Linearity
The relationship between input variable X and output variable Y must be linear: , not curved. Linear Regression can only draw straight lines or flat planes and cannot model curves.
When this assumption is violated, the model underfits, predictions become biased, and coefficients are misleading. Consider using Polynomial Regression, feature transformation (log, square root), or non-linear models to address this issue.
2. Homoscedasticity
The variance of residuals (errors) must be constant across all X values. Error spread should remain similar regardless of X. Linear Regression assumes equal confidence everywhere.
If violated, coefficients remain acceptable, but confidence intervals become wrong and hypothesis tests are invalid. Solutions include log-transforming Y, using weighted least squares, or applying robust regression techniques.
3. Multivariate Normality
Only the residuals must be normal—not X and not Y. Normality is required for valid p-values, confidence intervals, and hypothesis testing.
When violated, predictions still work, but statistical inference becomes unreliable. Address this by transforming Y, removing outliers, or using non-parametric models.
4. Independence
Each data point must be independent. One observation should NOT influence another. Common violations include time-series data, repeated measurements from the same subject, and sensor data with memory effects.
If errors are correlated, confidence becomes falsely high. Solutions include time-series models, mixed-effects models, or removing dependent samples.
5. No Multicollinearity
Input variables should NOT explain each other. An example would be house size in square feet and house size in square meters.
When features are correlated, coefficients become unstable, signs may flip, and interpretation breaks. Detect this using a correlation matrix or VIF (Variance Inflation Factor) . Fix by removing correlated features, combining features, or using regularization (Ridge/Lasso).
6. Outlier Check
Linear Regression is very sensitive to outliers. One extreme point can drastically change the slope and ruin predictions. Outliers are not always erroneous data but must be investigated, justified, and appropriately handled.
Address outliers by removing them if erroneous, transforming data, or using robust regression.
Summary Table
| Assumption | Meaning | If Violated |
|---|---|---|
| Linearity | Straight-line relationship | Underfitting |
| Homoscedasticity | Constant error variance | Wrong confidence intervals |
| Normality | Errors normally distributed | Invalid hypothesis tests |
| Independence | Observations unrelated | Inflated accuracy |
| No Multicollinearity | Features independent | Unstable coefficients |
| Outliers | No extreme influential points | Model distortion |